Power your status page metrics with your New Relic data
Connect New Relic Account
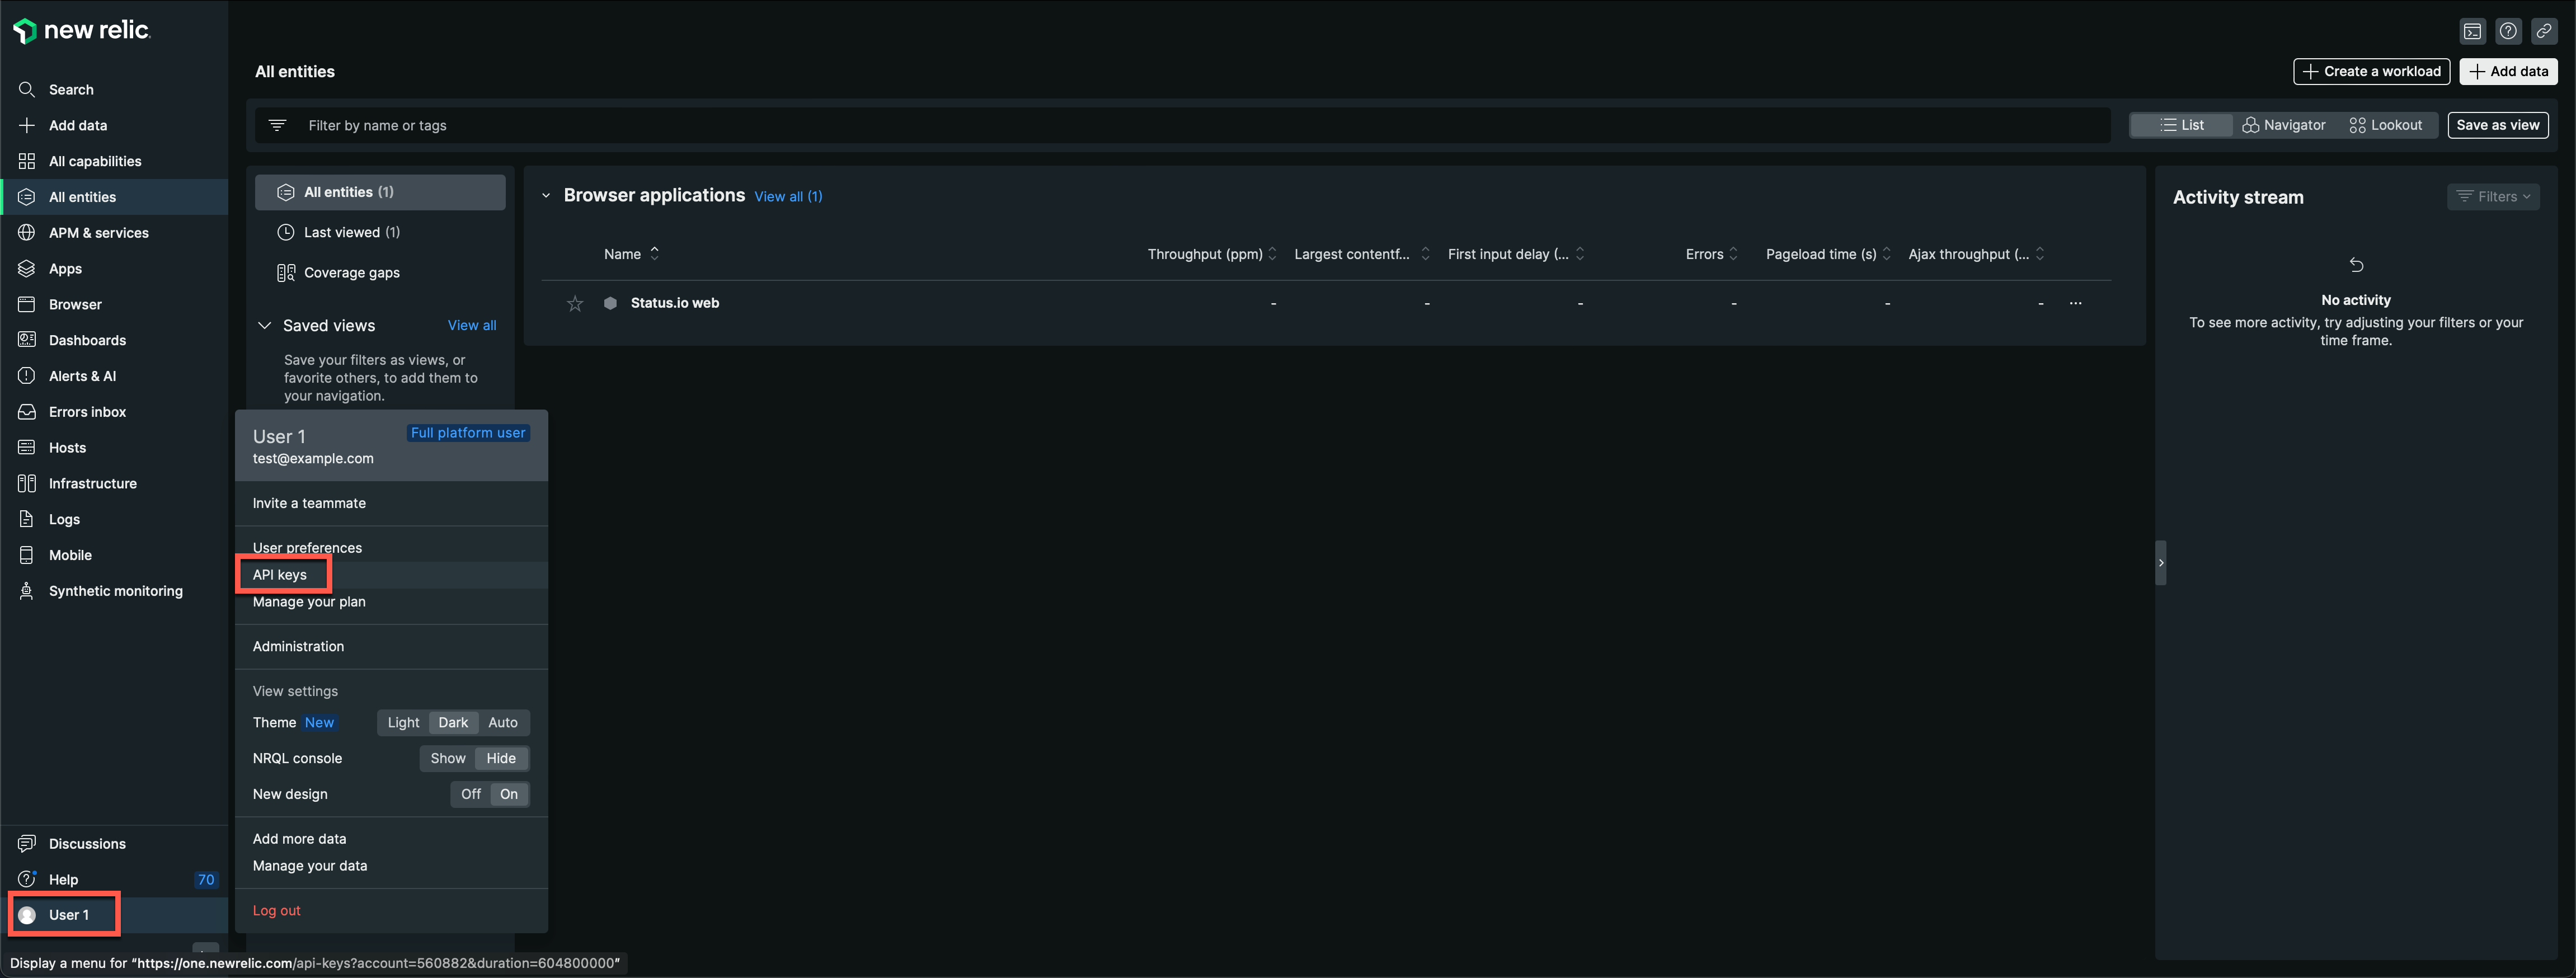
1. Sign in to your New Relic account
2. Click the user icon and then API keys
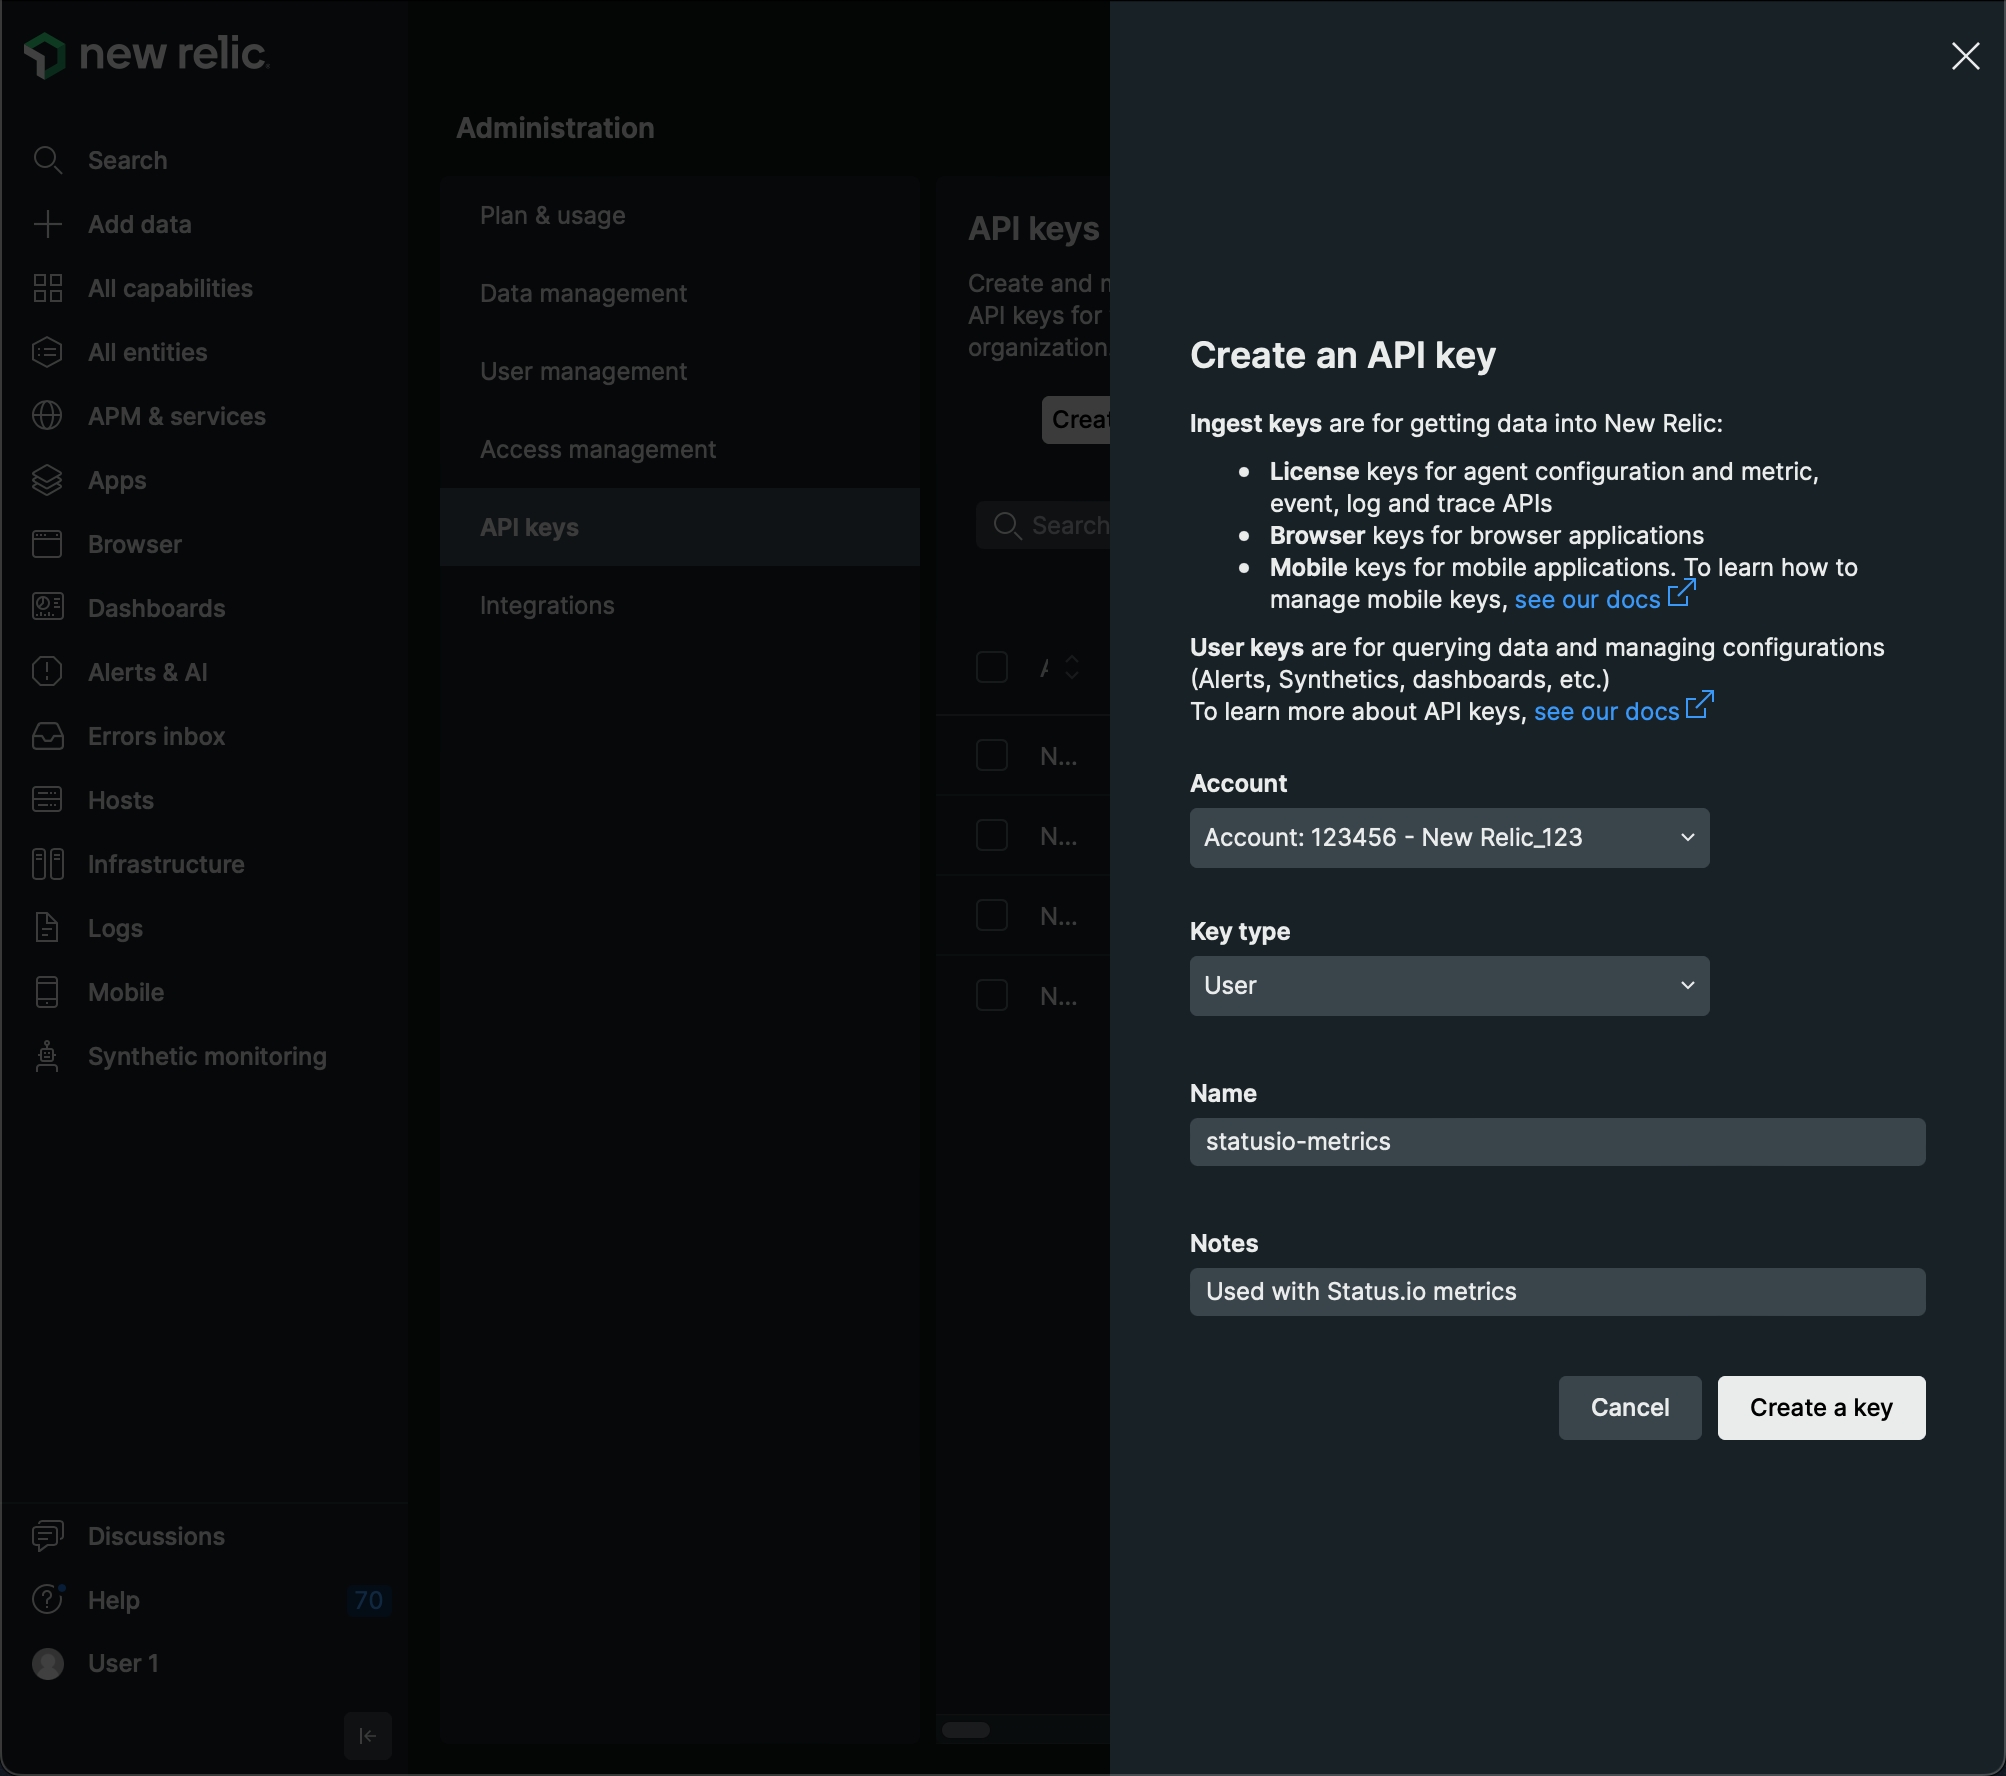
3. Click Create a Key
4. Select the New Relic account to use and enter a descriptive name for the new API key
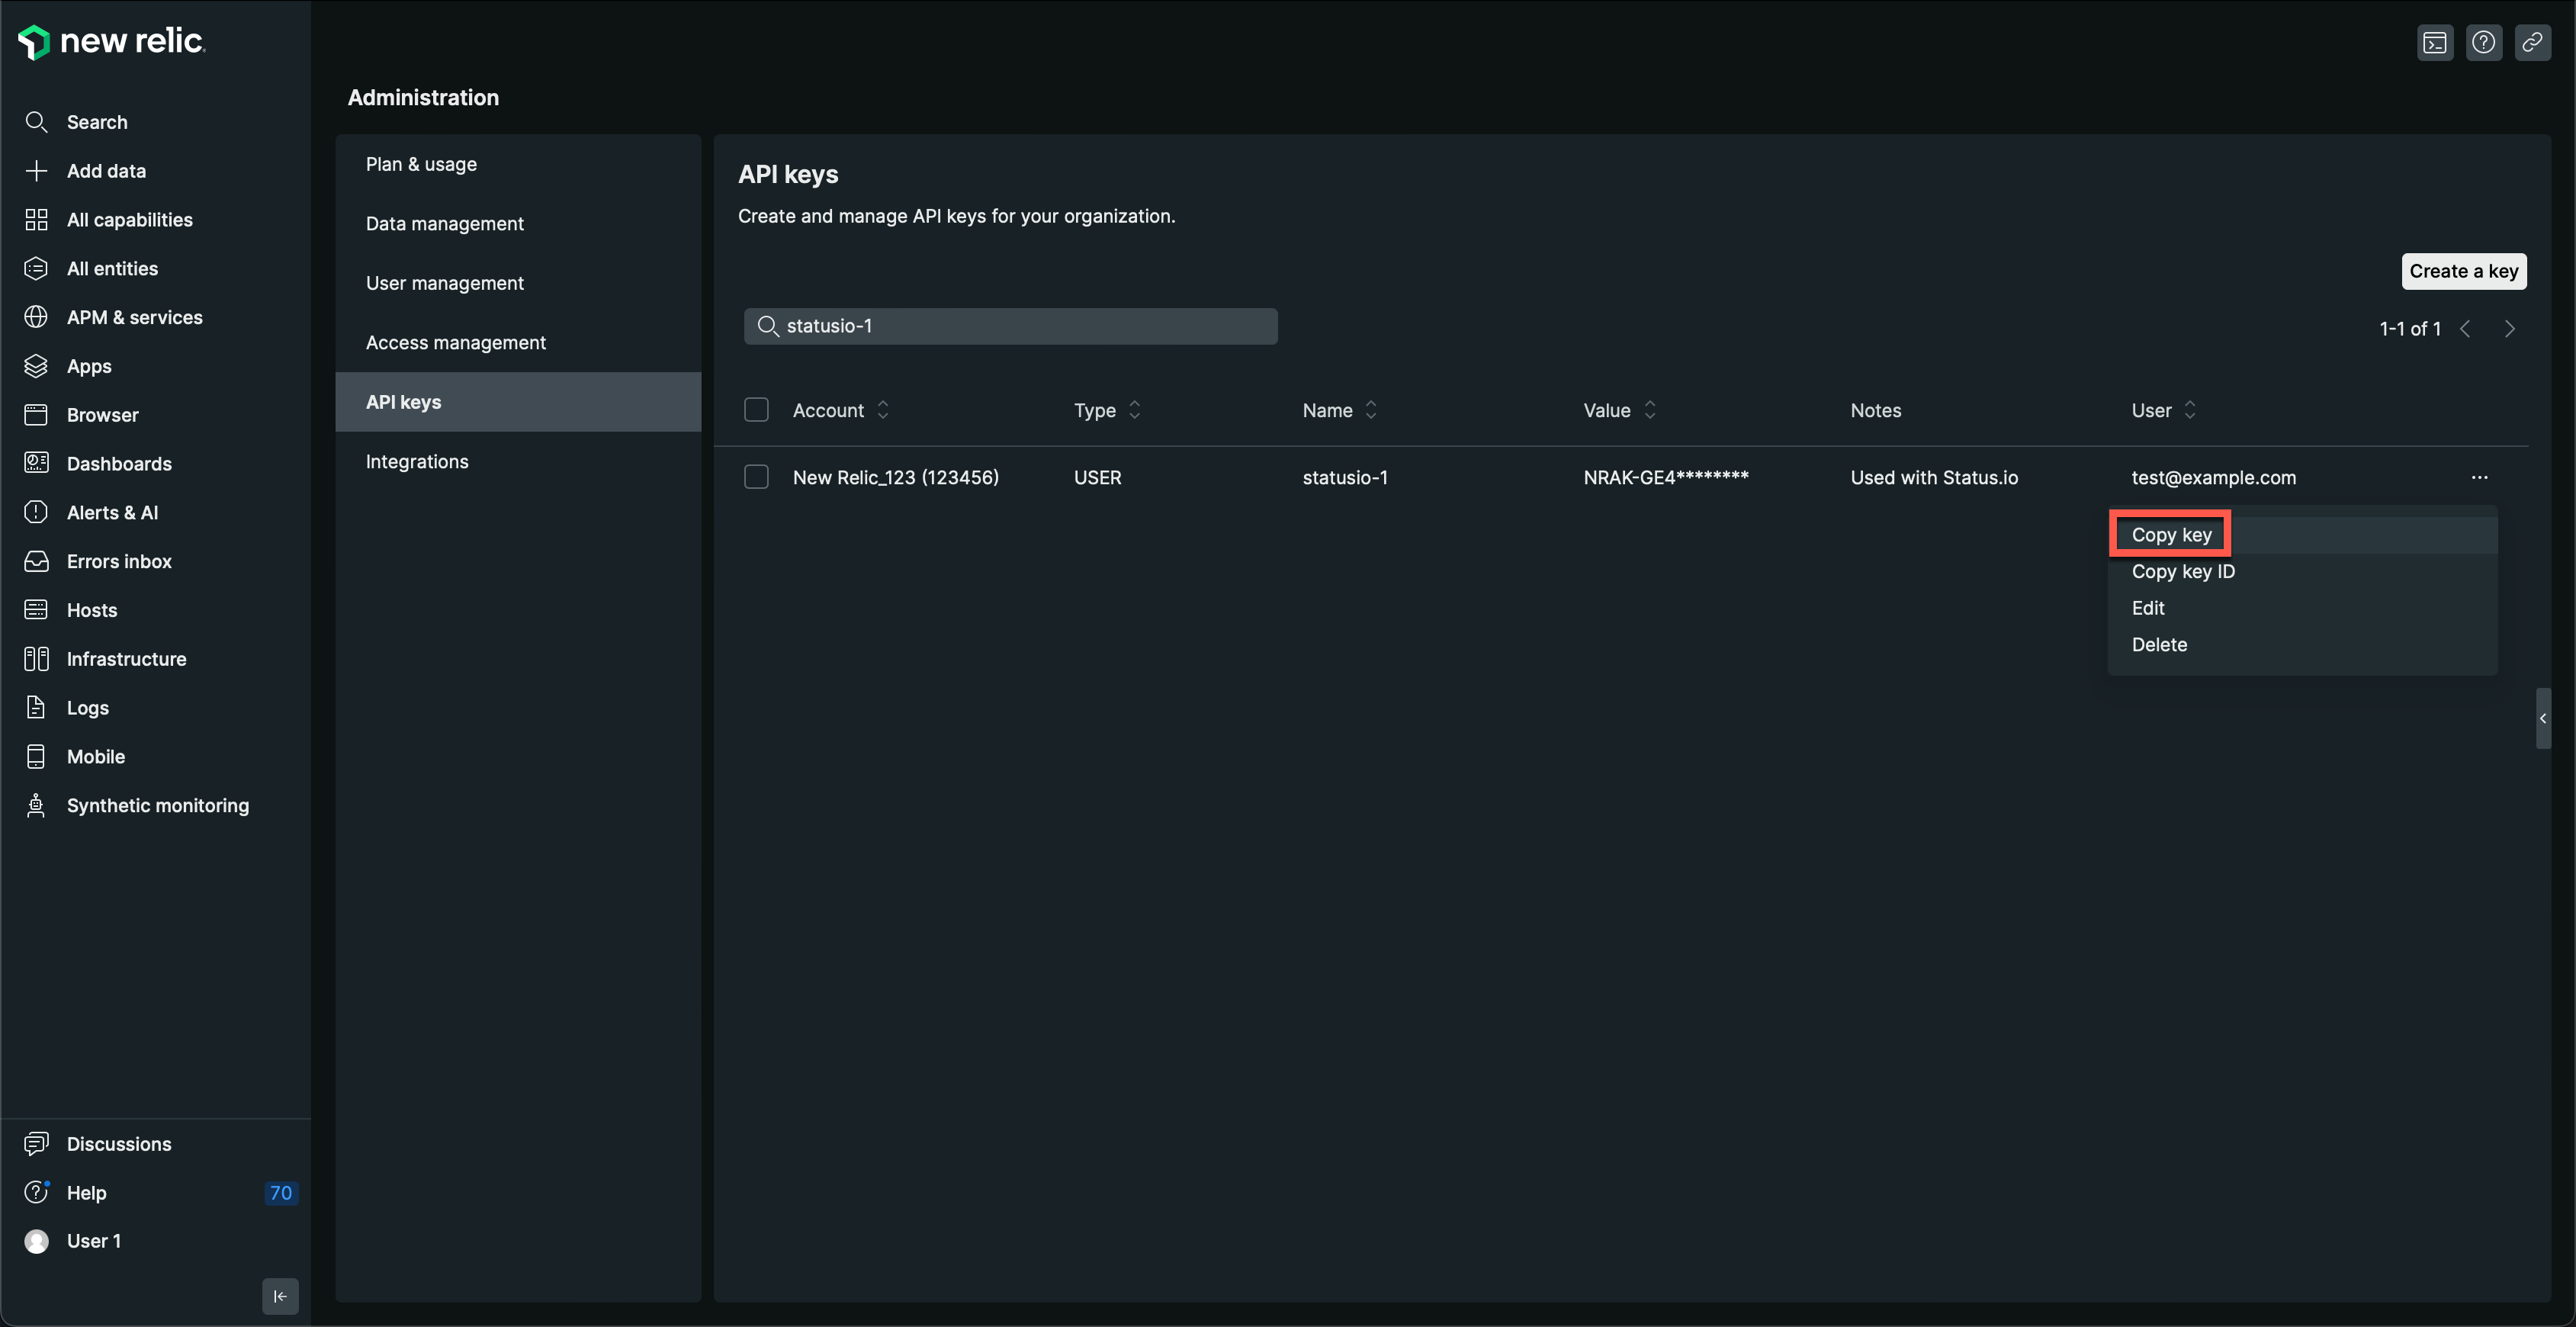
5. Copy the new API key
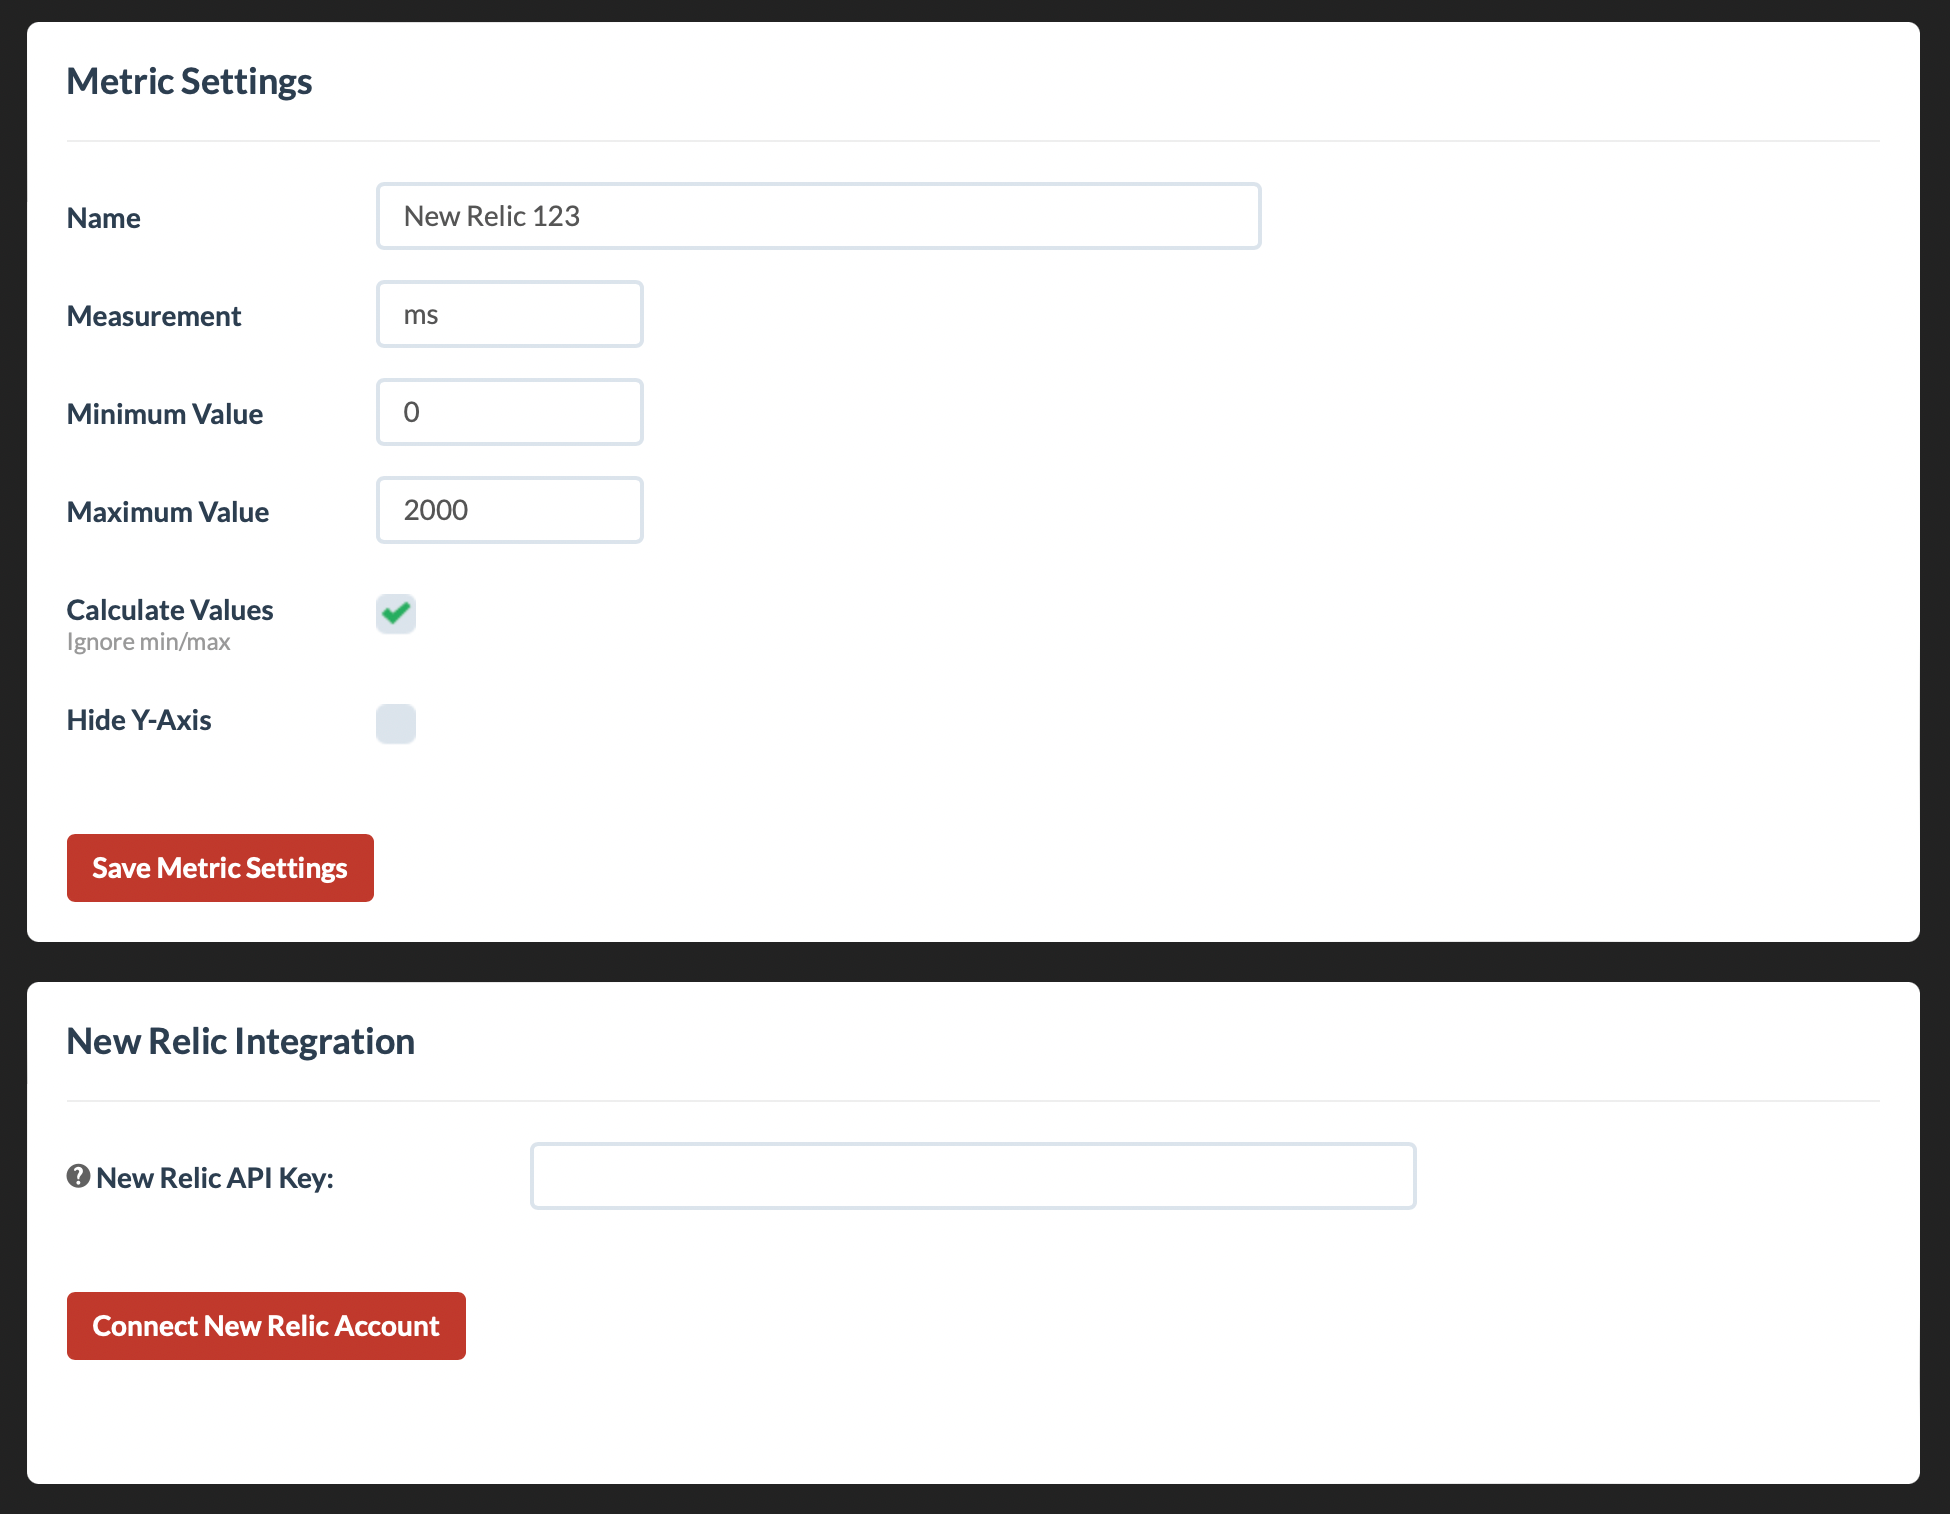
6. Create a new metric for your status page
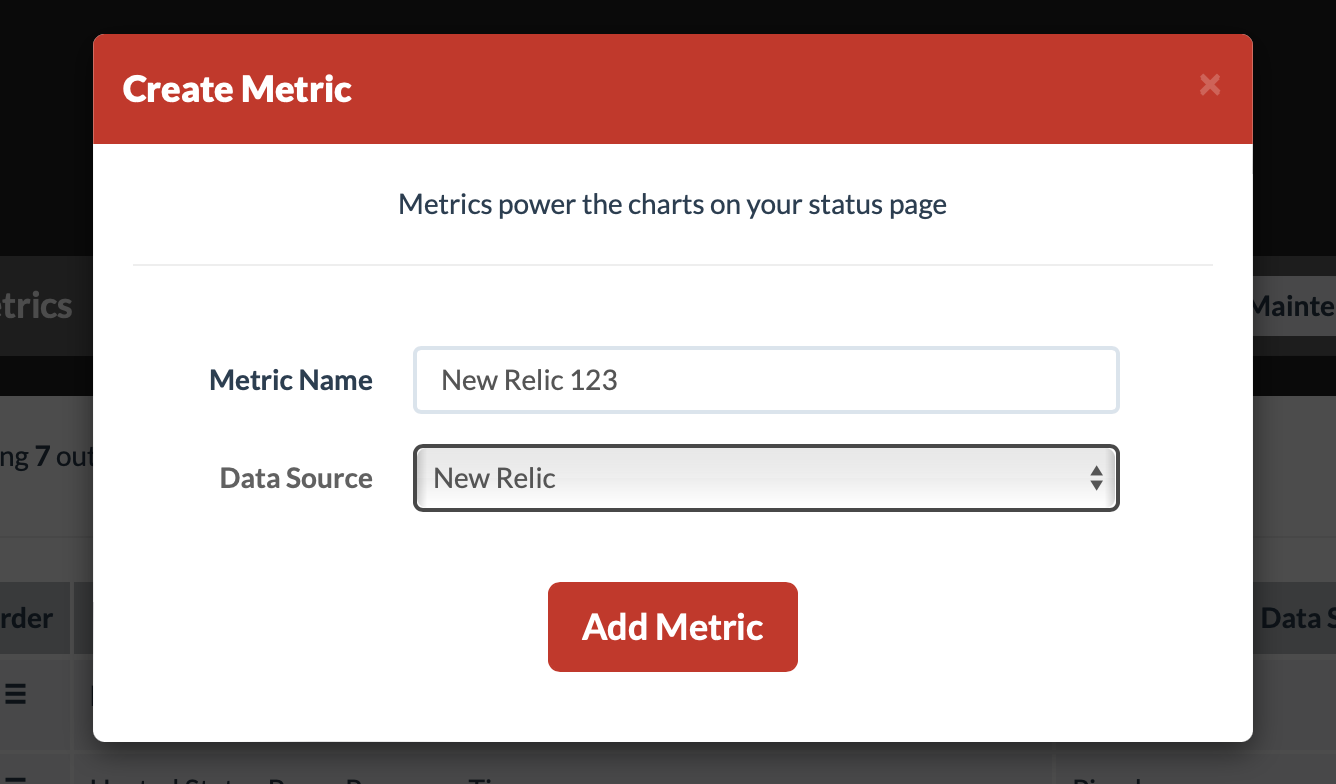
7. Enter the New Relic API key and click Connect New Relic Account
8. Select the Application and Metric
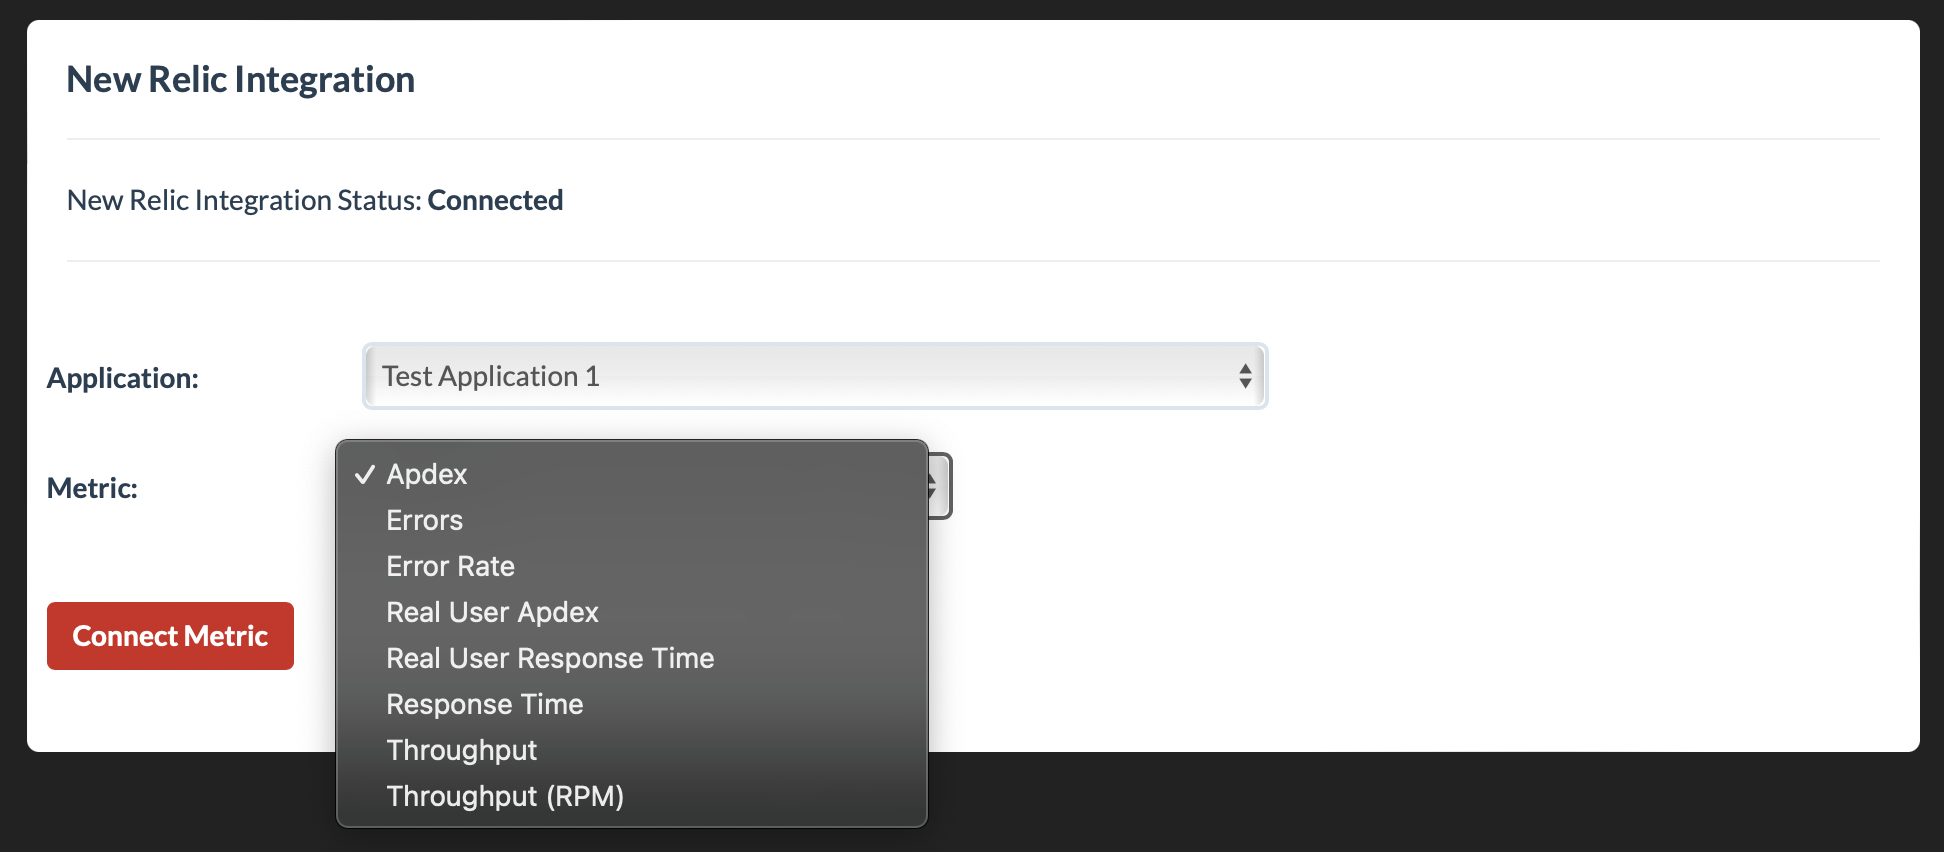
9. Click Connect Metric
10. Toggle the metric ON to display it on your status page
Available Metrics
- Apdex: Apdex score
- Errors: Total count of errors
- Error Rate: Errors per minute
- Real User Apdex: Apdex score for end users
- Real User Response Time: Average response time for end users
- Response Time: Average response time for web transactions
- Throughput: Web transaction throughput
- Throughput (RPM): Web requests per minute
Notes
- New Relic Lite accounts do not have access to metric data
- New accounts at New Relic may not have enough data yet and can require waiting some time before trying to connect the metric