The status banner (color and description) displayed on incidents works differently depending on where the incident appears.
Status Banner Behavior by Location
Active Incidents
Location: Main status page active incidents section
Behavior: Shows the latest status level color and description
When an incident is currently active, the banner reflects the most recent update’s status. This ensures viewers see the current state of an ongoing incident.
Example:
- An incident starts with “Degraded Performance” (yellow)
- Later updates show “Major Outage” (red)
- The active incident banner will show “Major Outage” (red) – the latest status
Historic Incidents – History Page & History Section
Location:
- Dedicated history page (/pages/history/[statuspage_id])
- History section on the main status page (when enabled)
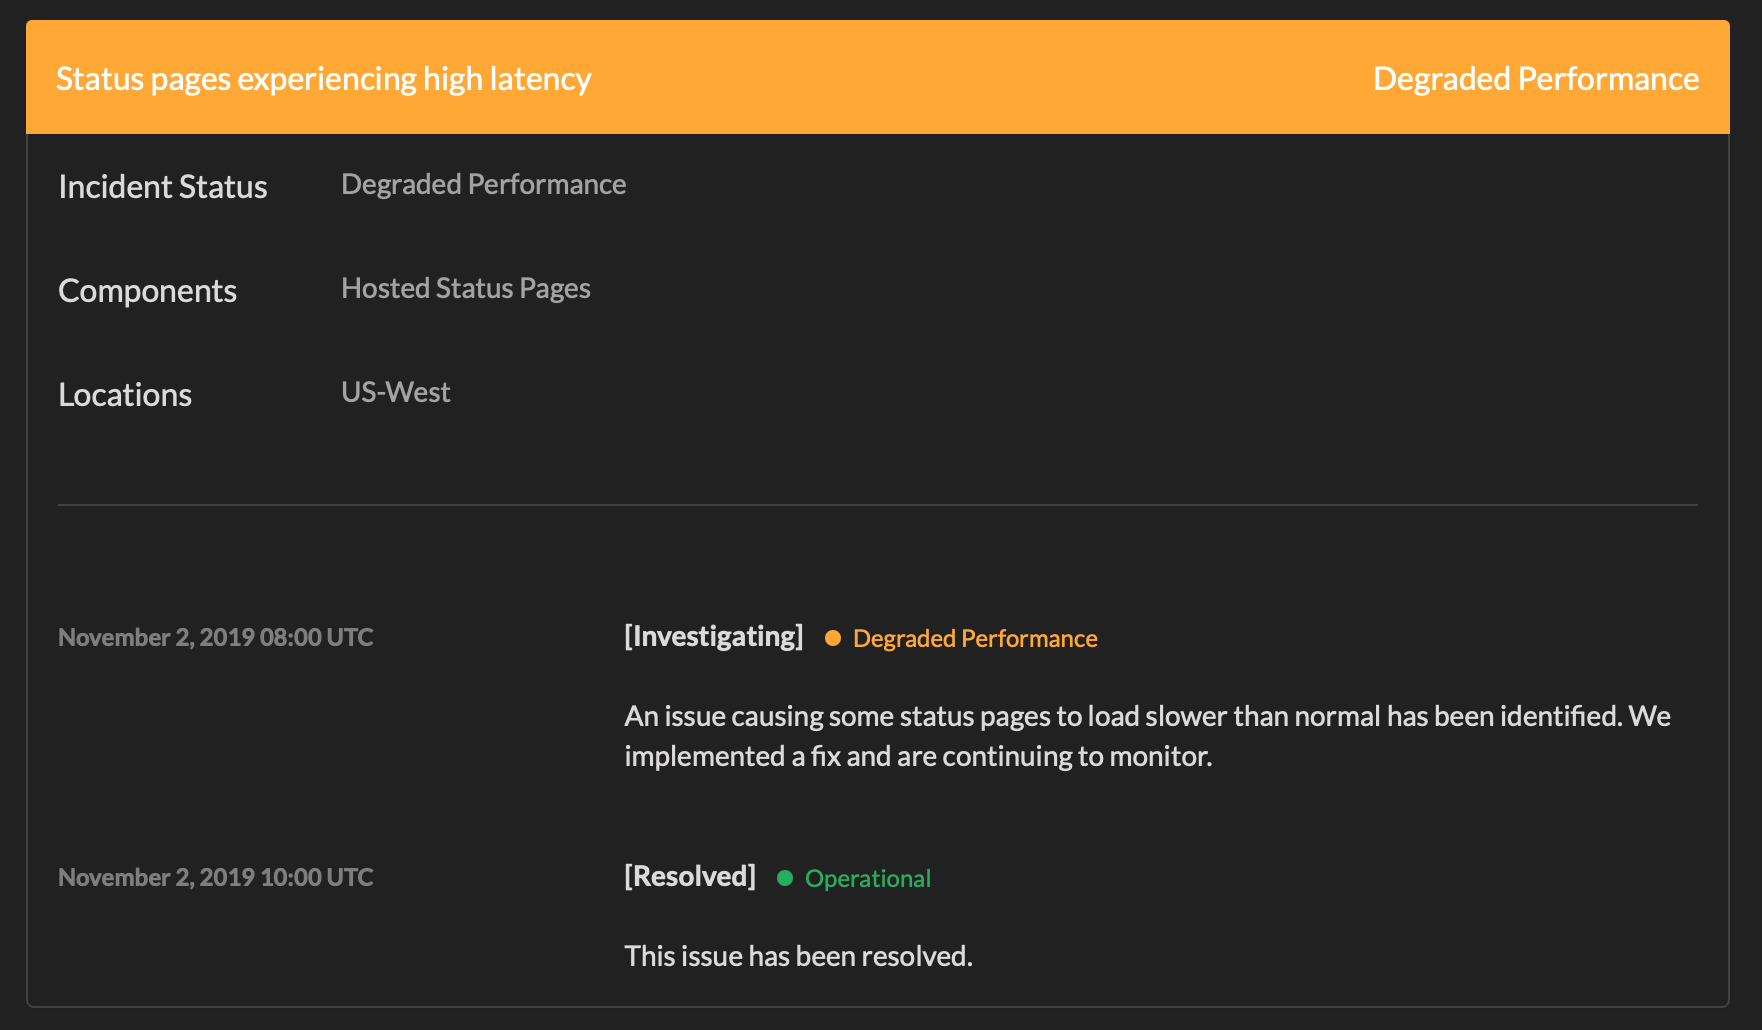
Behavior: Shows the first status level color and description
For incidents in the history timeline, the banner displays the initial status when the incident was first reported. This provides a historical perspective showing what the incident looked like when it began.
Example:
- An incident starts with “Degraded Performance” (yellow)
- Later updates show “Major Outage” (red)
- Finally resolved with “Operational” (green)
- The history banner will show “Degraded Performance” (yellow) – the first status
Why this design?
This approach preserves the historical context of the incident’s initial state, making it easier to understand the timeline at a glance when viewing multiple past incidents.
Single Incident Page
Location: Individual incident detail page (/pages/incident/[statuspage_id]/[incident_id])
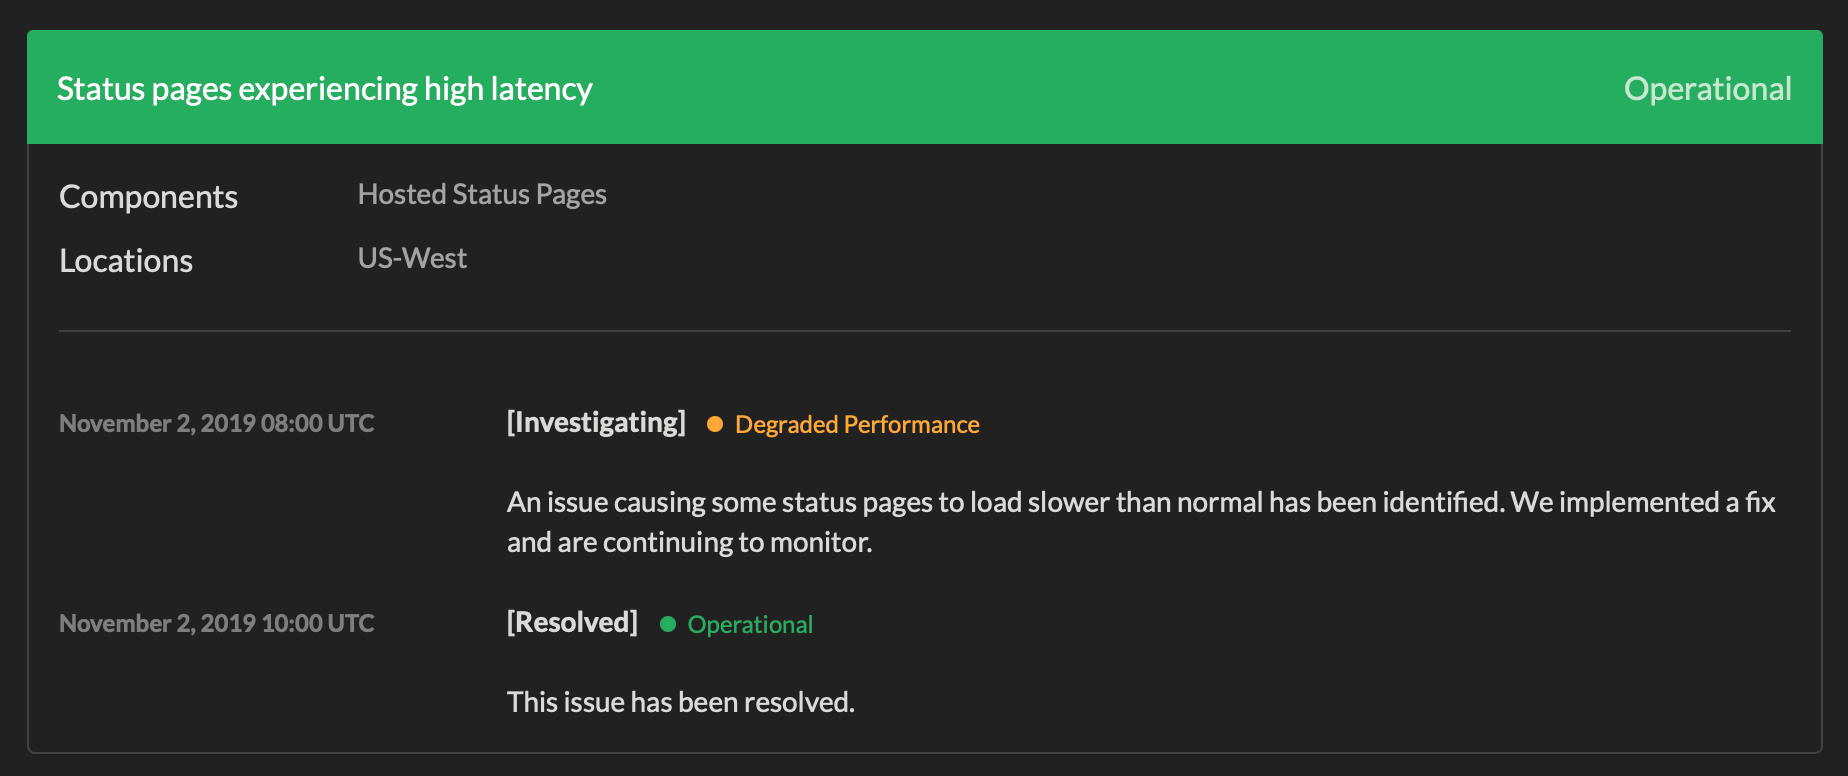
Behavior: Shows the latest status level color and description
When viewing a single incident (whether active or resolved), the banner displays the most recent status. For active incidents, this shows the current state. For resolved incidents, this shows the final resolution status.
Example (Active Incident):
- An incident starts with “Degraded Performance” (yellow)
- Later updates show “Major Outage” (red)
- The single incident page banner will show “Major Outage” (red) – the latest/current status
Example (Resolved Incident):
- An incident starts with “Degraded Performance” (yellow)
- Later updates show “Major Outage” (red)
- Finally resolved with “Operational” (green)
- The single incident page banner will show “Operational” (green) – the latest/final status
Why this design?
When viewing a single incident in detail, the most recent status provides the most relevant information, whether that’s the current status of an ongoing incident or the final outcome of a resolved incident.
Summary Table
| Location | Status Shown | Reason |
|---|---|---|
| Active Incidents | Latest | Shows current state |
| Single Incident Page | Latest | Shows current state (active) or final resolution (resolved) |
| History Page/Section | First | Preserves historical context |
Additional Notes
- The status banner color and description are determined by the status level assigned to each incident message
- Individual messages within an incident can each have their own status level, which is displayed inline with the message
- The banner represents a summary status for quick visual reference, while the full timeline shows all status changes