Status Charts
The Status Charts feature displays a 90-day historical status chart for your components on your status page, helping users understand the reliability and uptime history of your services.
What is a Status Chart?
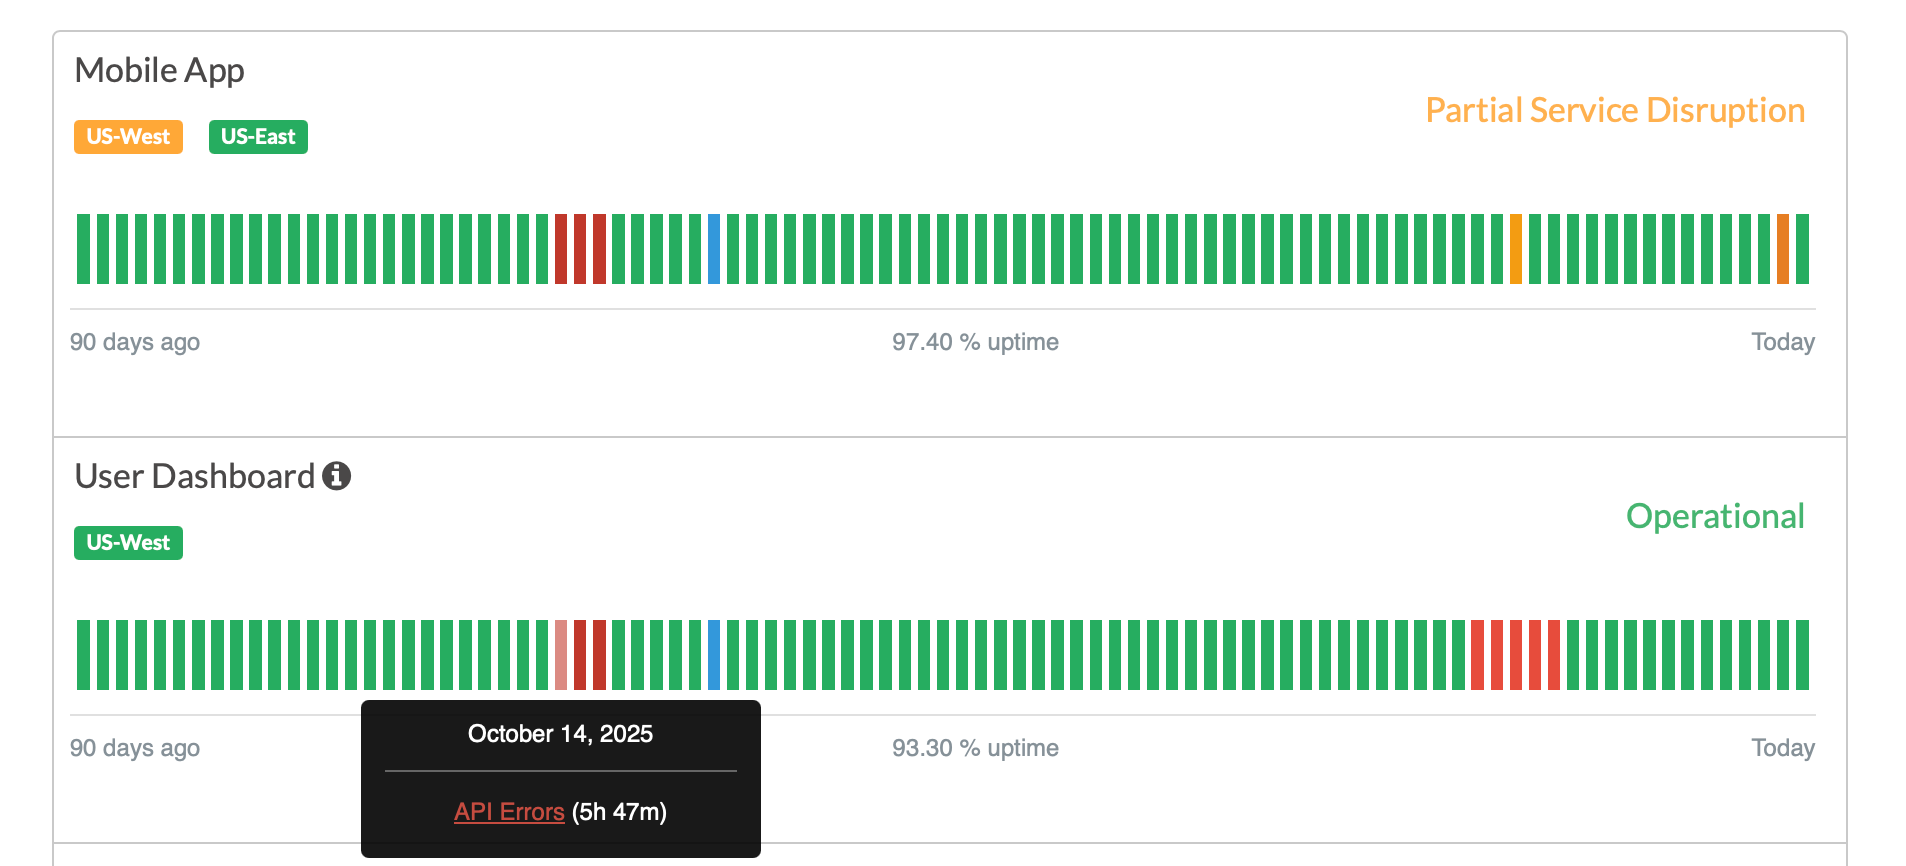
A status chart is a visual timeline showing:
- Component status history over the past 90 days
- Incident events that affected the component
- Maintenance events (optional)
- Uptime percentage (optional)
How to Enable Status Charts
- Log in to the Status.io dashboard
- Go to Components in the navigation menu
- Select the component and click Edit
- In the Status Chart section, configure these options:
Show the Status Chart – Enable or disable the chart display
Show Maintenance Events – Include maintenance windows in the chart
Show Uptime Percentage – Display the calculated uptime percentage below the chart
How Status Charts Work
Status charts combine incident and maintenance history from all containers attached to a component. The chart shows the worst status for each day across all containers, providing a comprehensive view of the component’s overall health.
Time Period: 90 days of historical data
Viewing Status Charts
Once enabled, status charts appear on your status page. Users can hover over individual days to see detailed information about incidents or maintenance events.
Best Practices
- Enable for high-traffic or critical components to show transparency
- Enable maintenance events if you want full transparency, or disable to show only incidents
- Enable uptime percentage to provide a quick summary metric for users
Troubleshooting
Chart Not Appearing:
- Verify “Show the status chart for this component” is toggled on
- Newly enabled charts may take up to 10 minutes to appear
Incorrect Data:
- Ensure incidents are properly associated with the component or its containers
- Verify “Show maintenance events” is enabled if maintenance should be visible
Frequently Asked Questions
Q: Can I customize the time period?
A: Currently, status charts display 90 days of historical data. This period cannot be customized.
Q: Do status charts work for private status pages?
A: Yes, status charts work on both public and private status pages.
Q: How is uptime percentage calculated?
A: Uptime percentage is calculated as the percentage of time the component was operational (status 100) versus total time over the 90-day period.
Q: What happens if a component has no incidents or maintenance?
A: The chart will display all days as operational (green), showing 100% uptime.