The Overall Status Level determines the message displayed in the status bar at the top of your status page. This message summarizes the current state of your system based on component activity and severity levels.

By default, the overall status reflects the highest severity level of any active component or event. You can also customize the text that appears when all systems are operational.
Status Bar Priority Logic
The status bar text follows this priority order:
- Both incidents and maintenances active: Displays “Active Incident and Maintenance.”
- Only maintenances active: Displays “Planned Maintenance In Progress.”
- Only incidents active: Displays “Active Incident.”
- Any component degraded or unavailable (status 300/400/500/600): Displays “Active Issue.”
- All systems operational: Displays “All Systems Operational” (or your custom operational text).
Customizing the Operational Text
You can modify the text shown when all systems are operational.
For example, you might change “All Systems Operational” to “Everything is Running Smoothly” or any message that fits your organization’s tone.
To update this text:
- Go to the Dashboard.
- Navigate to Design → Status Bar.
- Locate the Text to display when all systems are operational field.
- Enter your preferred text and click Save.
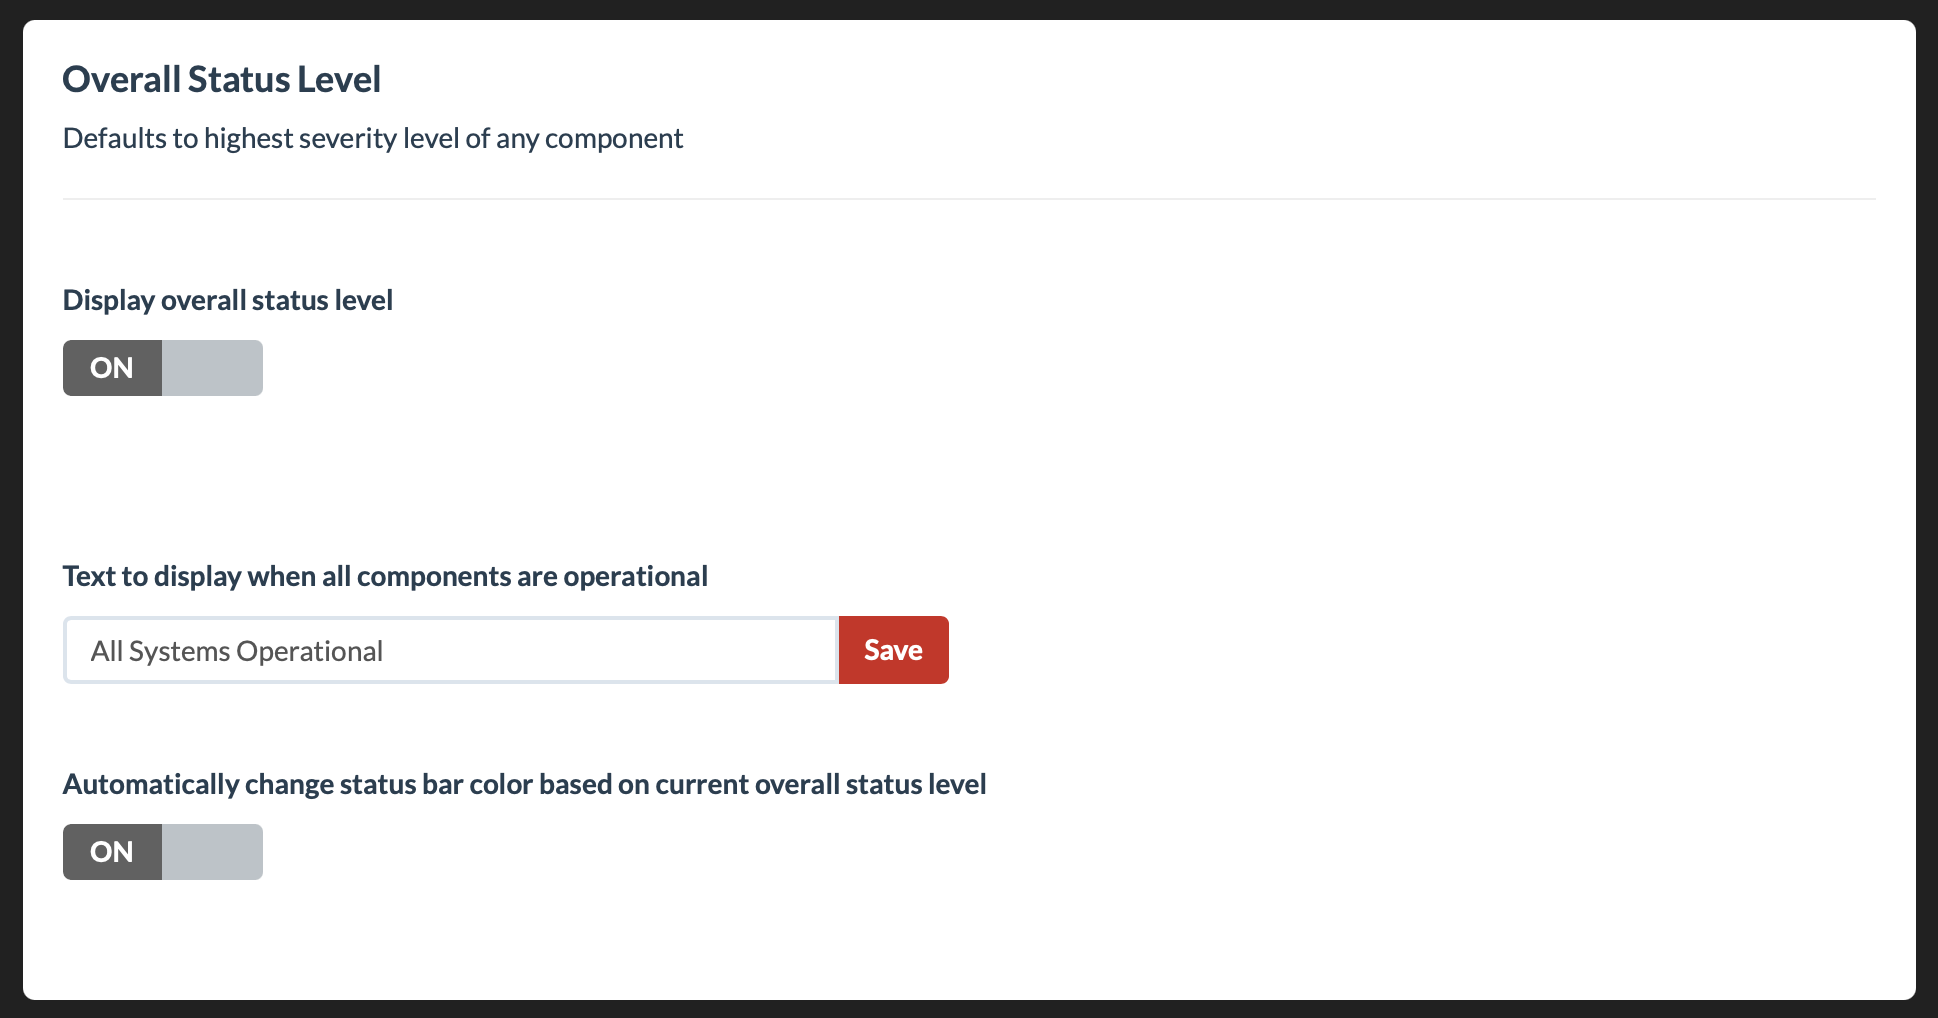
Automatic Status Bar Color
Optionally, enable Automatically change status bar color based on current overall status level to match the color of the status bar with the system’s current condition (e.g., green for operational, yellow for degraded, red for outage).